.svg)

Same salary range, $30k difference in market medians
Key topics
Here are two job openings at Uber with the same publicly posted salary range.
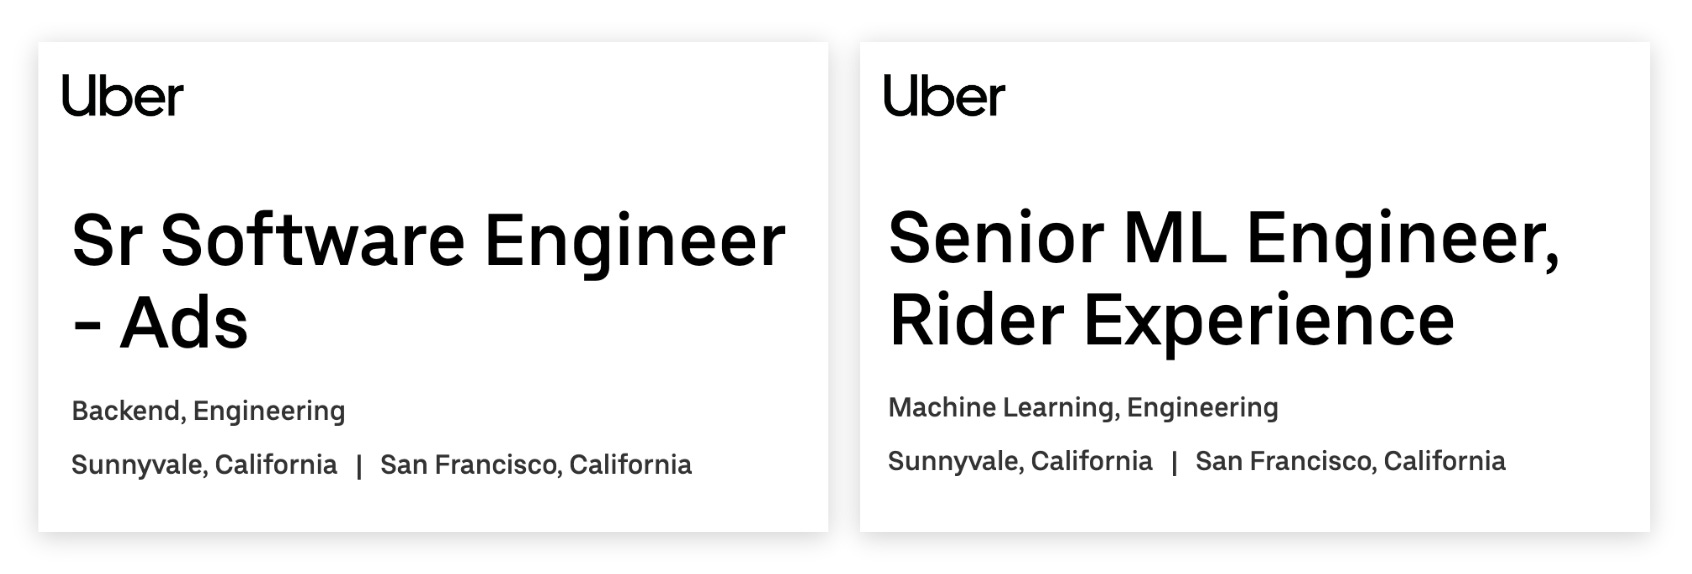
What do these roles have in common?
- both are Senior level
- both are based in Sunnyvale or San Francisco
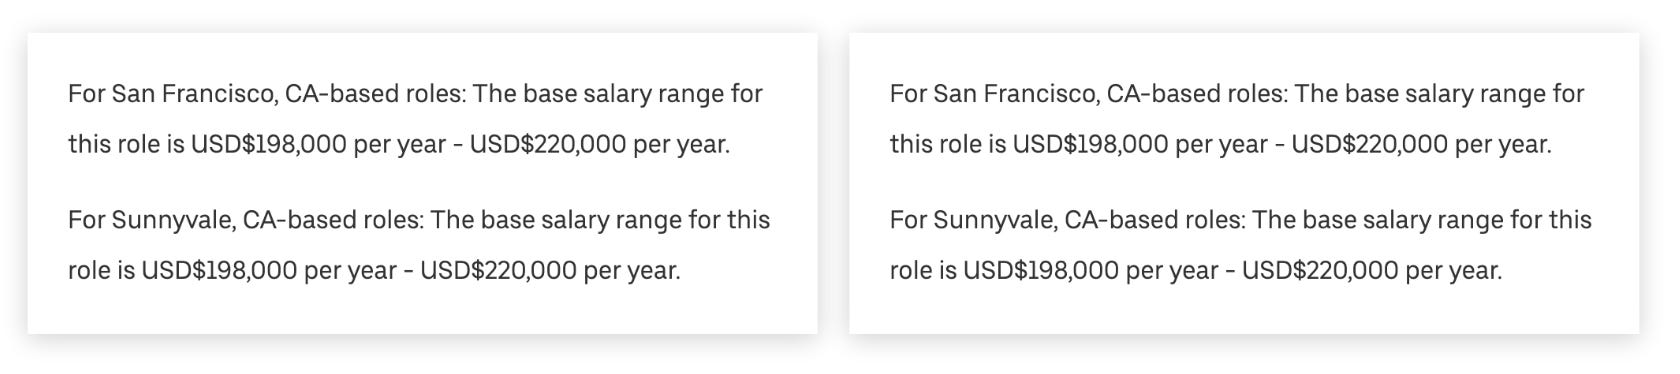
- and both jobs are posted with the same salary range of $198,000-$220,000:
However, one job is a SWE on the Ads team and the other is an MLE on the Rider Experience team.
Why do they have the same range?
Two possible reasons:
- Disclosure strategy — sometimes companies intentionally post the min and max of multiple job families (and levels and locations) to disclose a wider range, providing more discretion on how they transact individual offers. But given the tight 11% spread, this seems less likely for these roles
- Job architecture — many large tech companies (about half, according to Compa research), do not distinguish AI roles from SWE roles in their job architecture, either as a philosophical choice or due to lack of available reliable data for emerging jobs. As a result, ranges for distinctly different job postings drive off of the same job code. Meanwhile, how recruiters use these ranges vary when they encounter real market differences
So, should we expect the market to command different rates for these two roles, or the same, as the posted range might suggest?
Let’s analyze this in two steps — first using job titles, then using skills.
Analysis using job titles — SWE vs AIE
I looked in Compa at P3 offers by 75 public tech companies in the SF Bay Area over the last 12 months to analyze current market rates.
Methodology note: “Senior” roles could be either P3 or P4, it depends on company philosophy — I can’t tell based on a public job posting. Also, I might want to build a tighter peer group than 75 public tech companies, again depending on company philosophy.
Here’s how Uber’s range compares to the market P25-P75th for software engineers and AI / ML engineers:
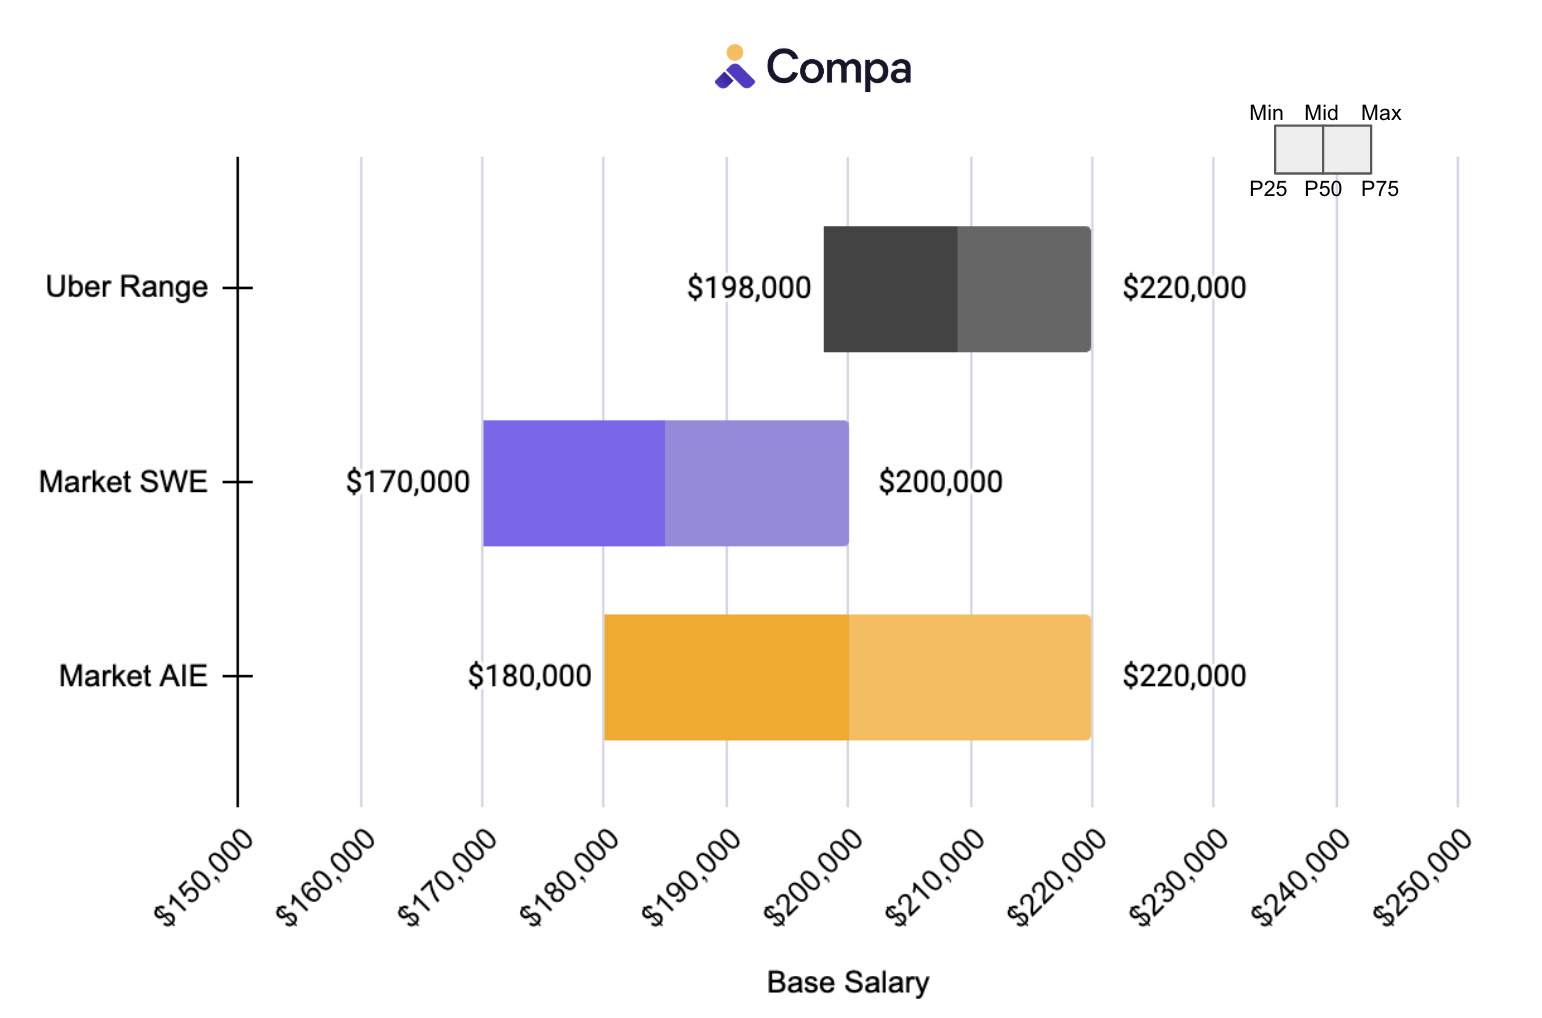
Benchmarked against Software Engineering, the lower end of the posted Uber range is approximately the 50th-75th percentile, with the rest of the range comfortably above it.
But benchmarked against AI / ML Engineering, the range approximates the 75th percentile.
So if the recruiter defaults to the midpoint of Uber’s range, $209,000, they will pay the Ads SWE well above the 75th percentile and the ML Eng closer to the 60th percentile.
This might produce an unhappy result, especially if hiring in AI is a priority.
But taking this a step further by analyzing the market with skills data reveals a bigger problem.
Analysis using skills — Node.js vs Pytorch
The job titles reveal differences in these two roles potentially hidden from the comp team by a shared job code. The skills in the job descriptions offer more clues:
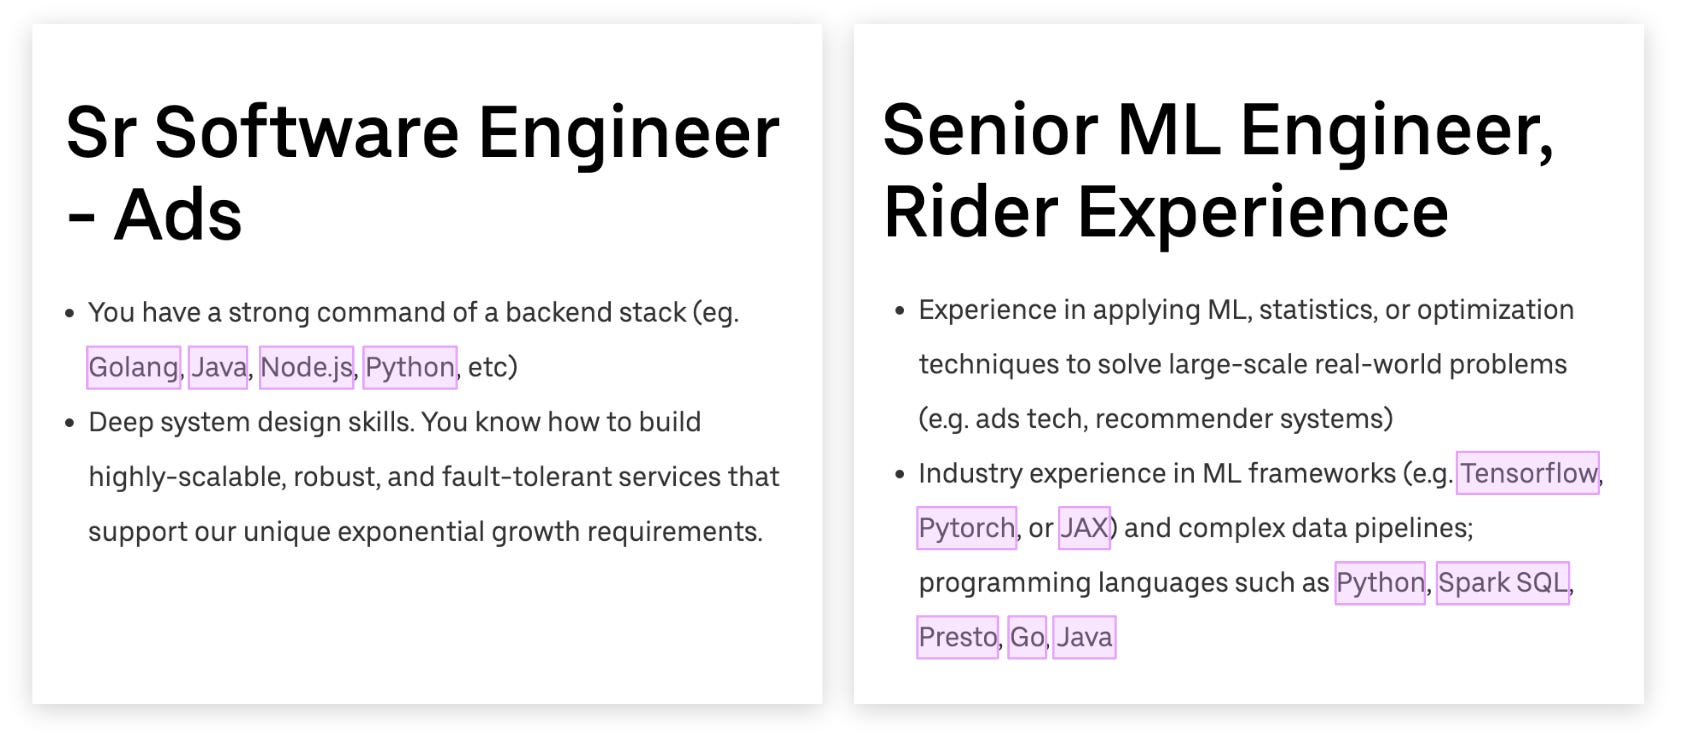
The Ads SWE role includes skills like Golang/Go, Java, and Node.js, while the ML Eng role requires ML framework skills in Tensorflow, Pytorch, or JAX. And some skills are overlapped, like Python.
These skills highlight further differences between the roles, and with Compa we can use skills to get more precise market measures.
I did this by building a “custom job,” where instead of relying on Compa’s job match architecture, I composed a set of skills filters based on each job description:
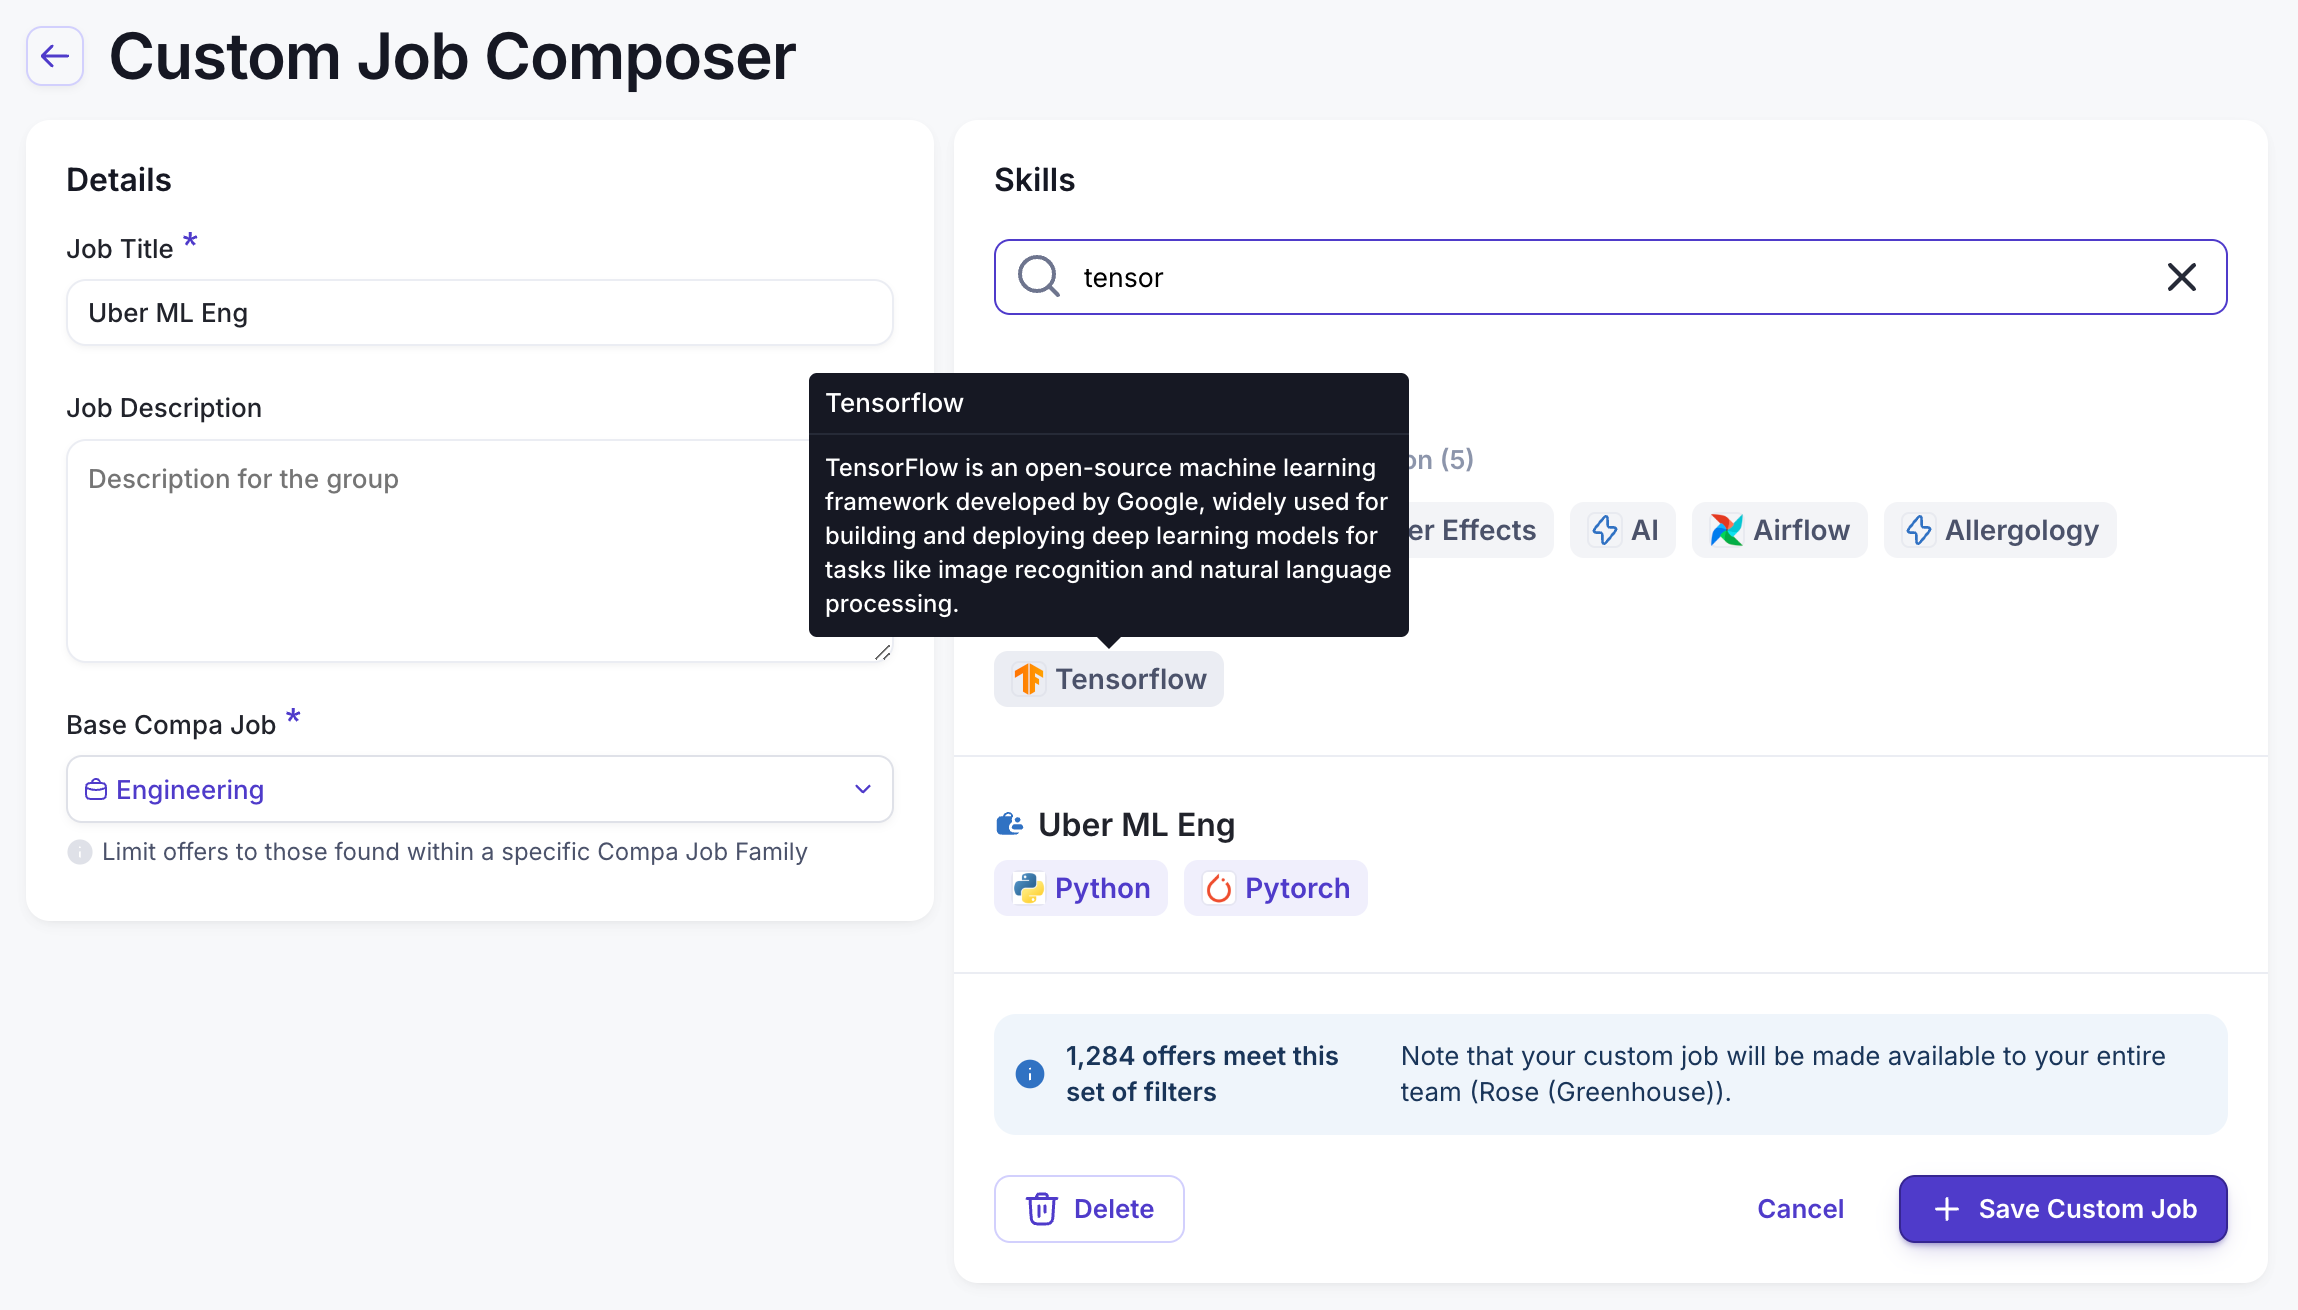
This approach reveals even wider market differences:
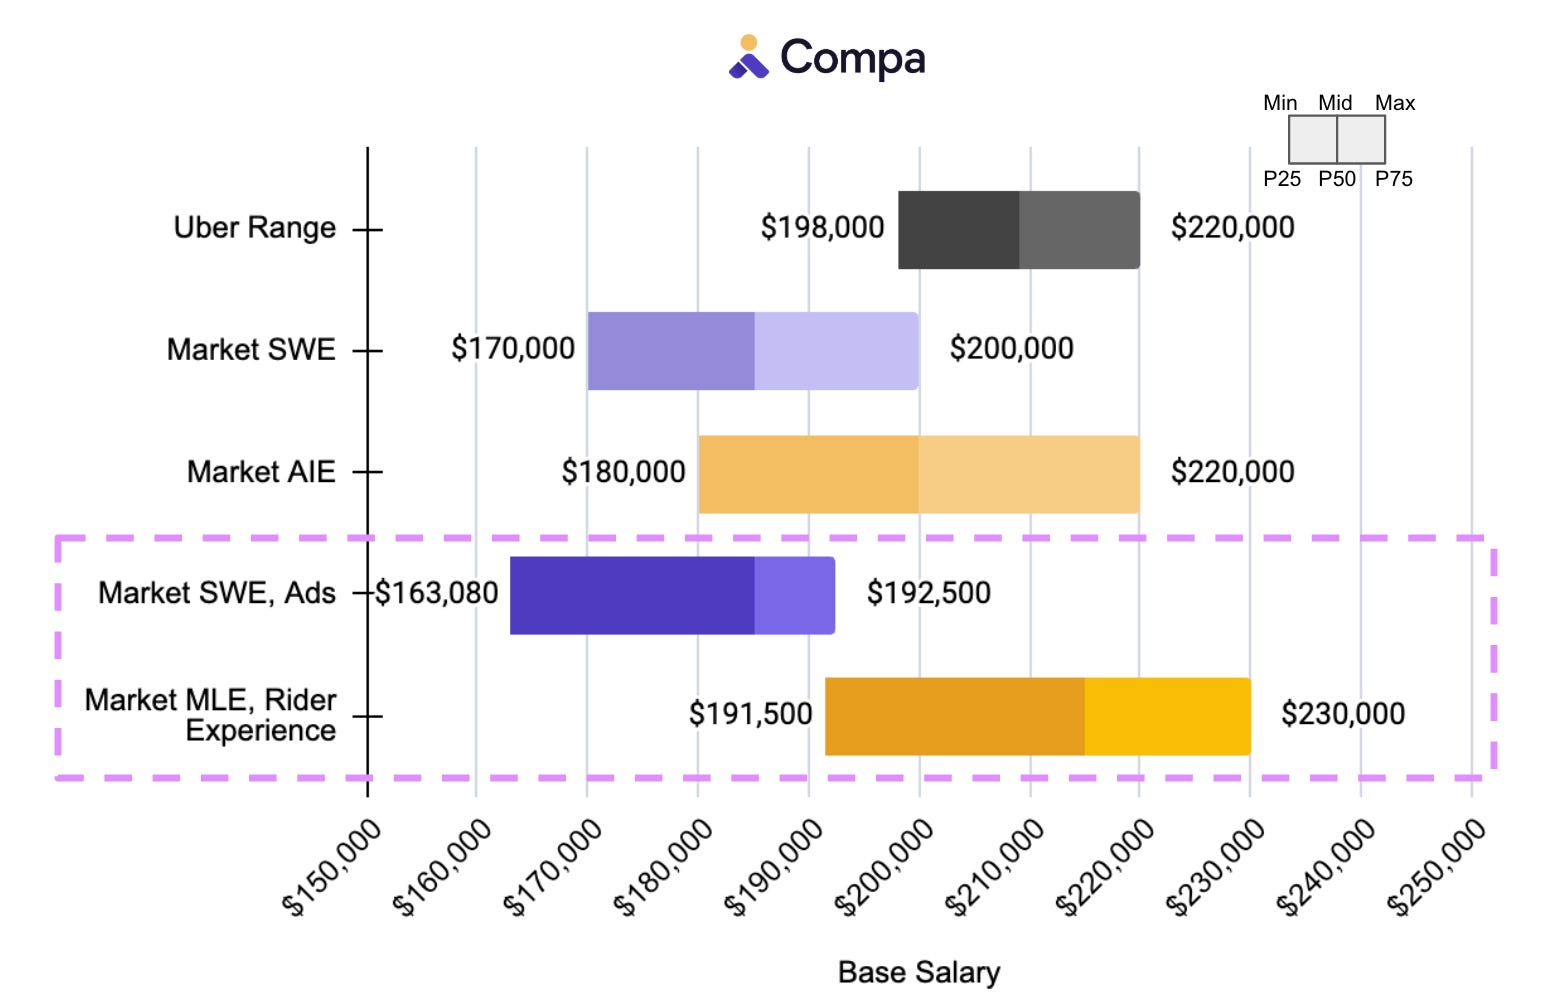
Using our custom jobs, the market range for the Ads SWE is $163k-$193k and for the MLE, Rider Experience is $192k-$230k.
This result shows completely different markets for two roles with the same base salary range:
- The MLE, Rider Experience median is $30,000 higher than the Ads SWE
- The Uber range midpoint of $209,000 is at the 44th percentile for the MLE, Rider Experience and above the 95th percentile for the Ads SWE
And stock comp (not pictured) shows even starker differences: total new hire grant median value is $137k higher for the MLE, Rider Experience.
Skills-based comp: promise and skepticism
This analysis uses a simple public job posting to illustrate the precision now available with offers-based market data, supercharged with skills, as an antidote to more traditional blunt instruments.
I had long been a skills skeptic, which I wrote about in-depth here. What changed?
New data (offers!), technology, and methodology make it possible to accurately see the market through skills, establishing a new level of precision comp teams can use to compete in challenging talent markets.
How do our conversations with the business change with skills comp data? Do we go so far as to change our job architectures?
We’re going to discuss the promise (and skepticism) of skills-based comp at Compalluminati 2025 — early invites are out, and I’ll share public details in my newsletter next week.
Peer Group is a newsletter for comp leaders navigating competitive talent markets! If you want to share my newsletter, you can forward this email to your colleagues and fellow comp leaders.
Want more polls and insights about the latest thinking in comp?

.webp)
.webp)
.webp)